12. Quiz: Choose Layers of Separation
Separating Data
Say you want to separate two types of image data: images of bikes and of cars. You look at the color of each image and the apparent size of the vehicle in it and plot the data on a graph. Given the following points (pink dots are bikes and blue are cars), how would you choose to separate this data?
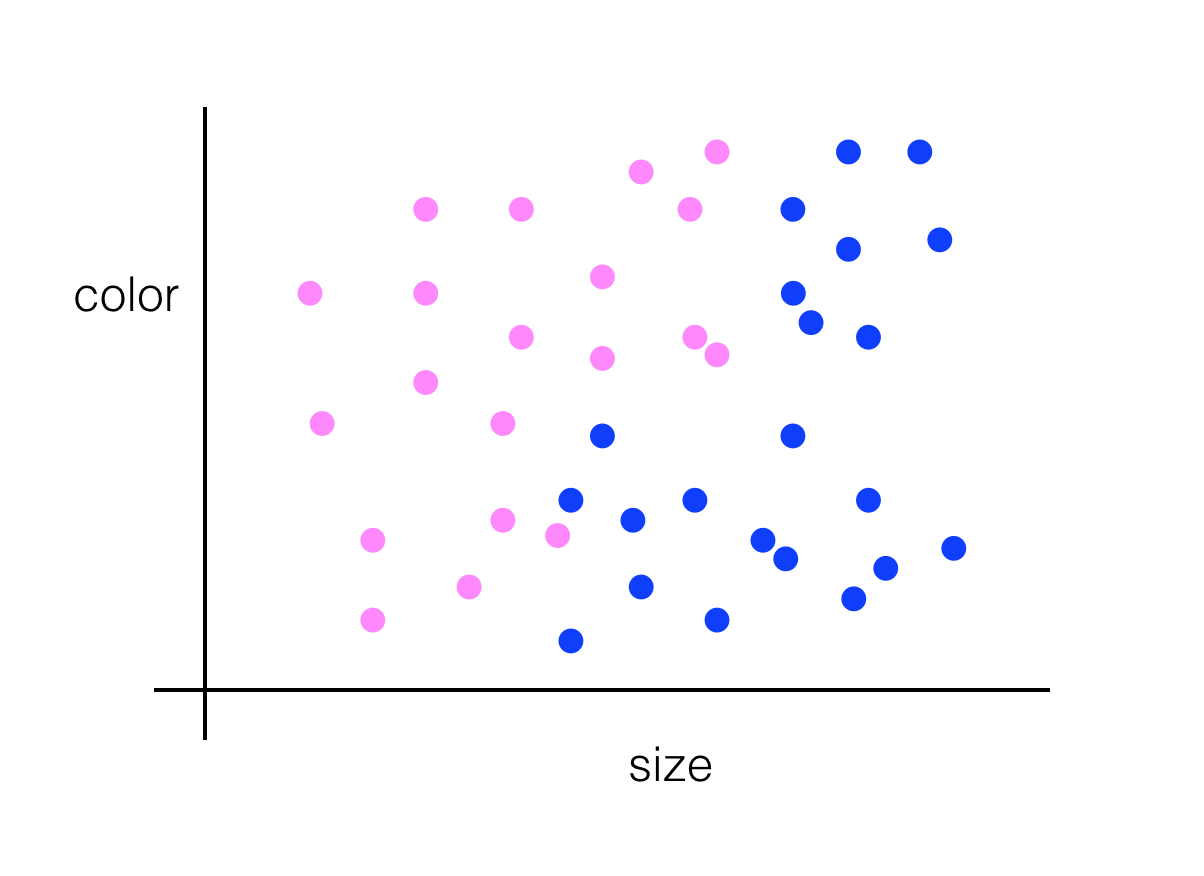
Pink and blue dots representing images of cars and of bikes.
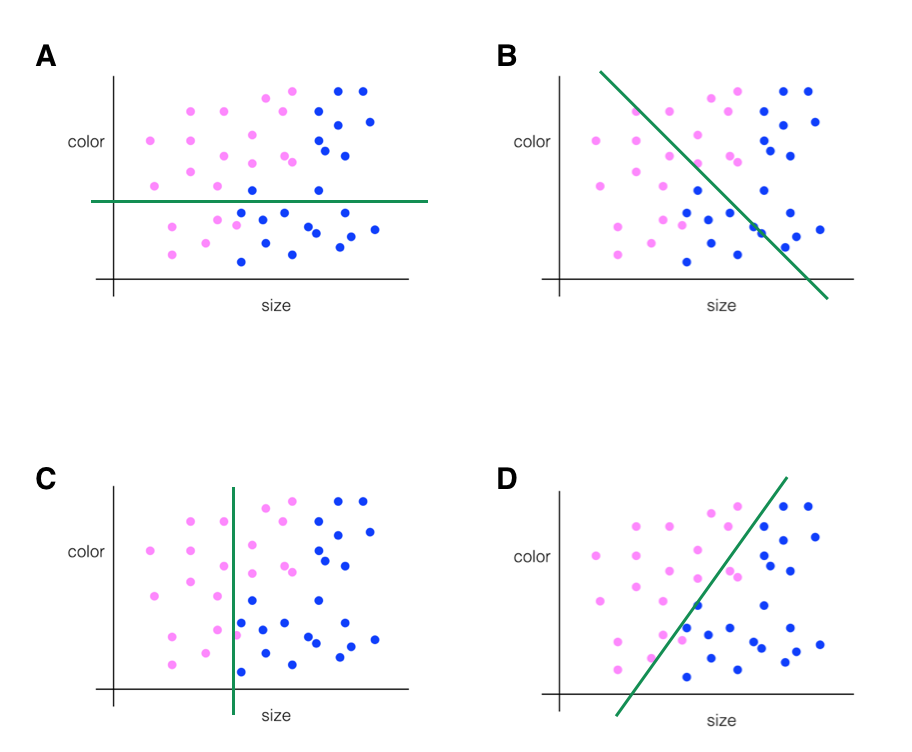
SOLUTION:
DLayers of Separation
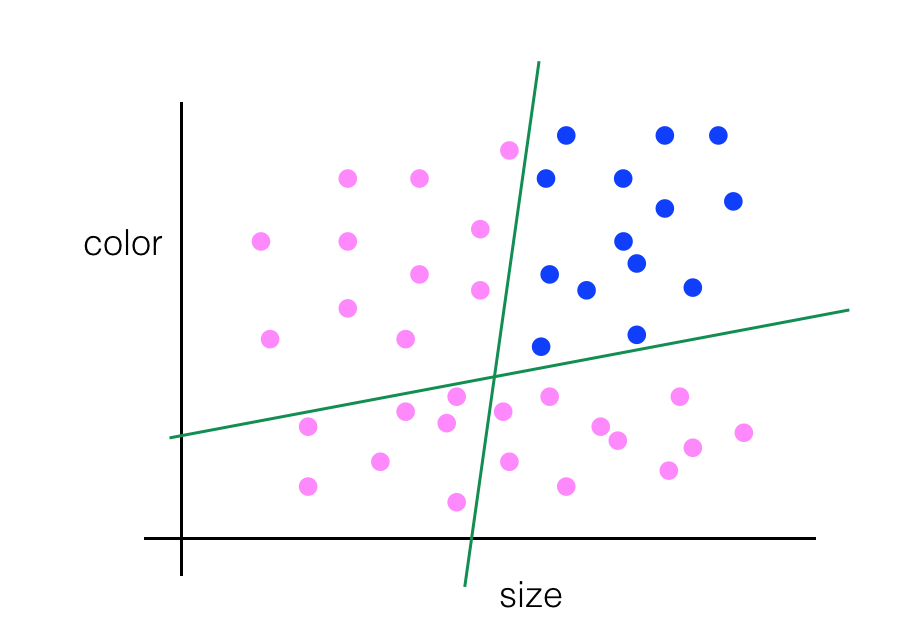
What if the data looked like this?
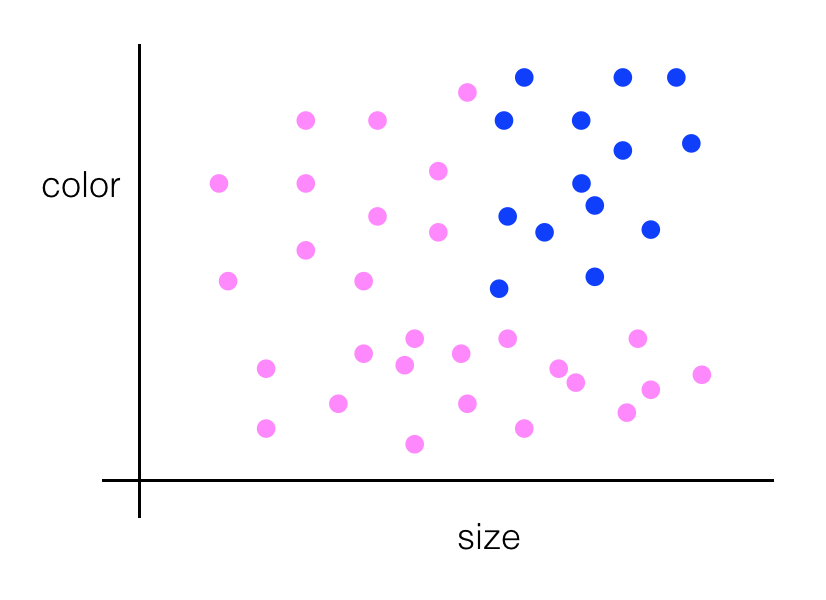
Pink and blue dots representing images of cars and of bikes.
You could combine two different lines of separation! You could even plot a curved line to separate the blue dots from the pink, and this is what machine learning learns to do — to choose the best algorithm to separate any given data.
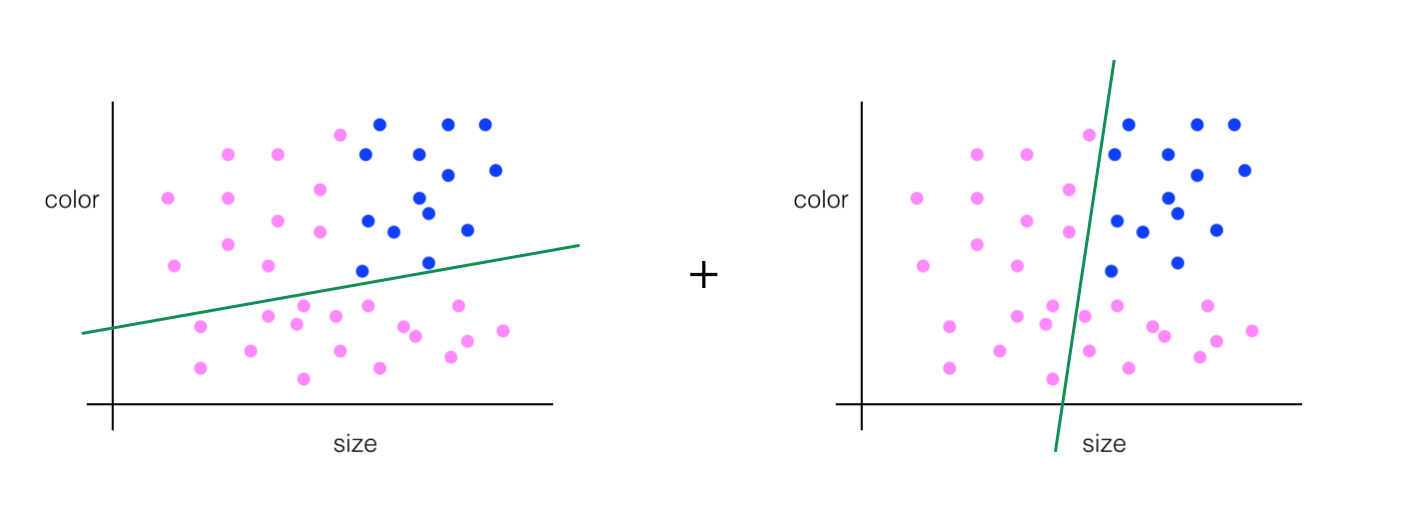
Separated data.